
In today’s world of e-commerce, processes and trends are constantly changing. Keeping afloat with the latest and best ideas is the only way to get ahead.
Attitude and expectations of e-commerce develop and advance and to facilitate that, we’ve put together a post of all the e-commerce statistics you need to know in 2019.
When you’re informed with all the information you need you’ll have the chance to grow and develop your e-commerce store to take it to new heights.
E-commerce demographic and buying behaviour statistics
You might have a clear idea of your e-commerce demographics but how does your store compare to others?
- When it comes to online shopping, men spend more than women
- Generation X spend more money online than Baby Boomers and Millennials
- Millennials conduct 54% of their purchases online
- There will be 1.92 billion global digital buyers in 2019.
- With an estimated global population of 7.7 billion people, 25% of the world’s population shop online.
- This number is rising rapidly and is expected to hit a massive 2.14 billion people in 2021.
Payment and pricing statistics
How much are your customers willing to pay and what pricing strategies should you use? Pricing statistics tell you a lot about that.
- By 2040, 95% of purchases will be through eCommerce
- 65% of Consumers use price comparisons on mobile while in a physical store
- In 2018, E-Commerce sales accounted for 11.9% of all retail sales in the whole world
- Over 254 million active PayPal accounts in The World
- Users who click on product recommendations lead to a conversion rate that is 5.5 times higher than users who don’t click
E-commerce review statistics
Generating reviews on your e-commerce store encourages other potential customers to buy from you too.
- 51% of Consumers trust companies who make It easy for visitors to contact the people behind the company
- 80% of Respondents Said They Had Stopped Doing Business with a Company Because of a Poor Customer Experience
- 30 % of Online Consumers Post Product Feedback Online
- 81% of Consumers Trust the Advice of Family and Friends Over Businesses
- 55% of online shoppers tell friends and family when dissatisfied with a product or company.
E-commerce email marketing statistics
- Email accounts as the biggest source of traffic to eCommerce sites after organic
- Users who read one welcome email will go on to open at least 40% of emails from the same brand in the following 180 days
- Only 51% of the UK’s top eCommerce brands are sending dedicated emails!
- 80% of consumers like to tey receive retail emails recommending products to them based on previous purchases
- 91% of Americans want to receive promotional emails.
Mobile commerce statistics
- Smartphones Accounted for 61 % of Retail Site Visits Worldwide
- 71% of mobile purchases are influenced by emails from the retailer
- 57% of mobile customers will abandon your site if they have to wait 3 seconds for a page to load
- 52% of people say they’re less likely to re-engage with a brand following a bad mobile experience
- 75% of Gmail users access their emails on mobile devices.
Small vs large retailers
How do small retailers compare to larger retailers like Amazon? Are the strategies the same?
- Amazon accounts for 44% of all ecommerce sales in the US
- 59% of 16-36 year-olds head to Amazon before any other E-Commerce website
- On average, 52 percent of online stores have omnichannel capabilities.
- Nearly 48 percent of online shoppers simply head straight to a large ecommerce marketplace.
- 2% of Amazon Echo owners have purchased a product via Alexa.
E-commerce statistics: Customer loyalty
Keeping your customers loyal is a tricky task when there are so many opportunities for them to purchase from another vendor.
- 30% of Consumers say they prefer to buy from a website they’ve bought from previously
- 76% of companies consider a customer’s lifetime value to be an important measure of success
- Only 18% of companies focus their resources on customer retention.
- 48% of all e-commerce transactions are from repeat customers
- 81 percent of consumers trust the advice of their friends and family over e-commerce businesses themselves.
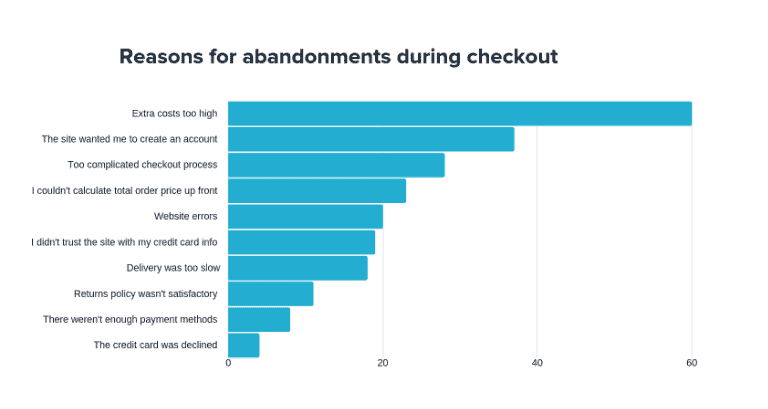
Abandoned cart statistics
When a customer lands on your site, browses your products and then fails to make a purchase, it’s known as an abandoned cart.
- Abandoned Cart Emails Sent within 20 Minutes Have an Average Conversion rate of 5.2%
- 60% of Online Shoppers abandon their carts because of unexpected extra costs
- Abandoned cart emails have an average open rate of 45%
- Almost 70% of online baskets are abandoned but there are ways to encourage customers to complete their purchase
- The average order value of purchases from basket abandonment emails is 14.2% higher than typical purchases
source: https://www.oberlo.com/blog/ecommerce-statistics-guide-your-strategy
E-commerce website statistics
Getting your e-commerce website set up with nice product photography and descriptions is a great way to convince users to purchase from you instead of your competitors.
- 38% of people will leave a website if the layout or design is unattractive
- Users who click on product recommendations lead to a conversion rate that is 5.5 times higher than users who don’t click
- Sites that take longer to load experience fewer conversions
- 64% of customers find customer experience more important than price.
- 79% of people who don’t like what they find on one site will go back and search for another site – usually your competitors
E-commerce customer service statistics
Customer service is a crucial element of e-commerce that can set your store apart from all your competition.
- ⅔ of consumers expect a same day response to queries about a product
- Poor customer service isn’t a joke. Companies lose an average of $62 billion annually due to poor customer service.
- When faced with bad customer service, people tell an average of 15 people within their network
- Improving your customer service by just a fraction can yield an average of $823 million increase over a 3 year period for a company with $1 billion in annual revenues.
- 4% of people are likely to switch brands if they find the purchasing process too confusing.
Takeaways
Now that you’re equipped with the various e-commerce statistics you can start making incremental changes to your store to ensure that it grows and expands at the rate you’d like it to.


Comment (1)
Jyotirmay Samanta
15.07.2019Great list of Stats! Very helpful.
Comments are closed.